Modernizing the spreadsheet experience with Tactyc
We Owe a Debt of Gratitude
Perhaps only an Excel nerd would feel the world owes a massive debt of gratitude to spreadsheet programs for driving personal computer adoption, and thus all the human productivity growth that resulted, but in fact, this is not far from the truth. The first widely-adopted spreadsheet program, VisiCalc was originally released in 1979, and quickly became a killer app for the Apple II personal computer. VisuCalc’s popularity inspired IBM to release the IBM PC in 1981, and in January 1983, Lotus 1–2–3 exploded on the scene making the IBM PC a must-have device for anyone in business. Truly, VisiCalc and Lotus 1–2–3 converted the microcomputer from something for hobbyists into an essential device for millions of people.
Microsoft debuted their own spreadsheet program called Multiplan in 1981 but it never really caught on, and that program gave way to Microsoft Excel which was released for the Macintosh in 1985. The PC version of Excel premiered on Windows 2.0 in 1987 and as Windows grew to be the dominant operating system of that decade, Excel became the king of spreadsheet software. Today there are over 1.2 billion users of Microsoft Office, and an estimated 650 million users of spreadsheet software worldwide, meaning nine out of every 100 people on planet Earth are probably using Excel.
The World Runs on Excel
In a world becoming more complex, the need for Excel only increases. On a most basic level, Excel helps users better understand how various inputs affect different outputs. The ability to break down intricate systems and model out the dynamics between the inputs and outputs in those systems through logic and math is the beauty of Excel. Businesses of all types rely on the insights gleaned from these models and spreadsheets (for the purposes of this essay, we think of spreadsheets as the medium used to create models).
Microsoft Excel has become the de facto programming language for business. Because the world runs on Excel, it is easy to understand why this relatively simple program has remained one of PC killer apps for the past 35 years. This is not to say others have not come for the crown: Google Sheets, and Airtable more recently have improved on some of Excel’s shortcomings around collaboration and have taken market share, but for the most part, business people — especially those working in corporate finance, banking and investing functions — have stuck with Excel and plan to do so long into the future. Some finance professionals even say you’ll have to pry Excel out of their cold dead hands.
Innovation Needed

Despite its staying power, Excel does have some notable limitations. One of those, as mentioned above is around the collaboration of teams working together effectively around shared models.
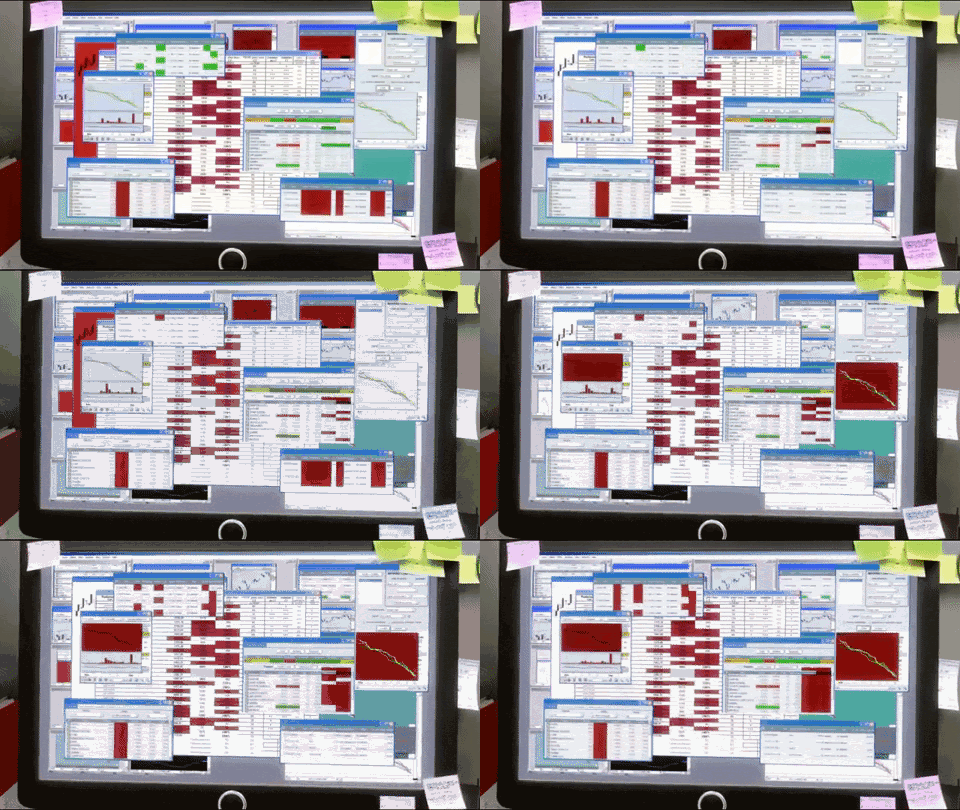
Related to this problem is that there is normally one party that builds the models (usually those young, overworked financial analyst Excel wizards), and other parties that need to see, interpret and use the data outputs from those models to make decisions. The disconnect between these two parties causes problems. The typical “wall of numbers” overwhelms most users, requiring analysts to export static images when communicating complex financial analysis with others. Making on-the-fly changes to various Excel model inputs and instantly seeing the corresponding changes in outputs cannot be done efficiently. If a manager were to ask one of her analysts “what would be the impact on our EPS if sales in Segment X decreased by 10% and hiring in Segment Y increased by 5%”, there would be no quick and efficient way for that analyst to flex multiple linked models across multiple segments and geographies.
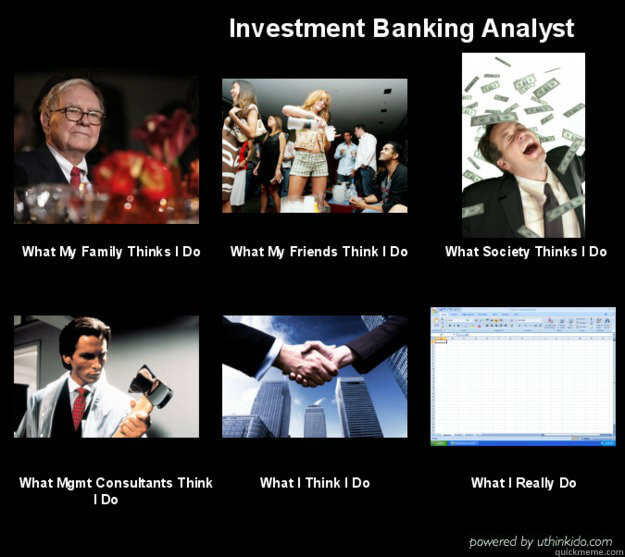
Making changes to a model and sharing the new outputs is an inefficient and iterative process. You change a few assumptions, run the model, cut and paste the charts and tables into an email or report, then rinse and repeat with new assumption changes. Annually, a group of 10 investment banking analysts can spend over 5,000 hours building and running these kinds of models — including complex Monte Carlo simulations,and other sensitivity analysis — and then understanding the ever-changing analysis resulting from these models.
Additionally, to get the maximum value out of Excel you need to either be a financial analyst or have one working for you. What about the vast majority of the non-pro Excel public who might benefit from the powers of this program? Currently, Excel’s true value is locked inside an ecosystem of professional users — unlocking that value would not only vastly improve financial and business literacy, but also the world’s understanding of business dynamics.
Exploring a Solution

Internally at MaC, we’ve tried everything from Google Sheets, to Airtable, to an attempt at Tableau, to figure out a better way to utilize the power of Excel both internally and externally. Today we are excited to announce that we’ve led the pre-seed round of Tactyc, an elegant and easy-to-use consumption platform geared towards decision-making around Excel models . Tactyc is a Los Angeles based startup transforming the way people and organizations interact with spreadsheets.
Founded in 2019 by former investment banker Anubhav Srivastava, Tactyc unlocks the power of financial models by transforming spreadsheets into dynamic web based interfaces that allow users to manipulate complex financial models from any browser and run nuanced scenario analysis or Monte Carlo simulations in seconds.
Anubhav is a killer founder with near-perfect founder-market fit. He received an undergraduate degree in electrical and electronics engineering from Georgia Institute of Technology, then worked four years helping businesses navigate complex problems at Amdocs and Capgemini before getting his MBA from the Wharton School of Businesses. He then spent the following eight years working in both investment banking as well as corporate strategy and business development where he earned his secrets that led to the creation of Tactyc. Anubhav taught himself how to code and built Tactyc for himself and the millions of people out there like him.

What Is a Tactyc?
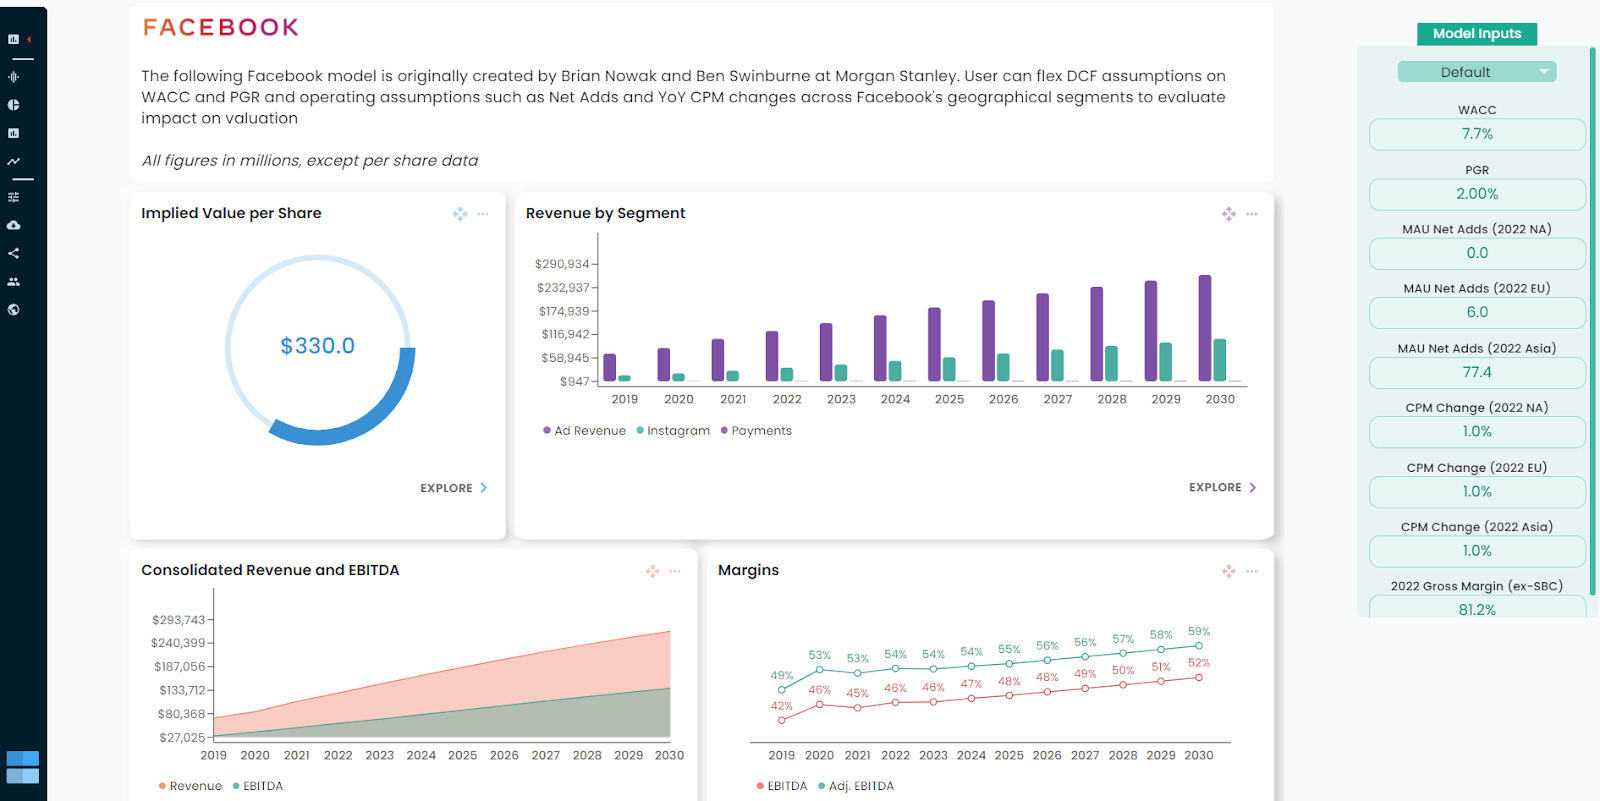
A “tactyc” is a browser-based, fully-dynamic, graphical output product that empowers anyone to instantly answer “what-if” questions from complex analysis. A tactyc is created from the ingestion of an underlying Excel model. Once uploaded to Tactyc, the model and all its data, formulas and logic are converted into scalable code in the cloud. Users select various model inputs and outputs to be displayed (and made interactive) in the tactic.
End users interact with the model on any device and any platform (including eventually inside of publications and blog posts). This live dashboard enables users to focus on key metrics and evaluate multiple scenarios with just a few clicks.
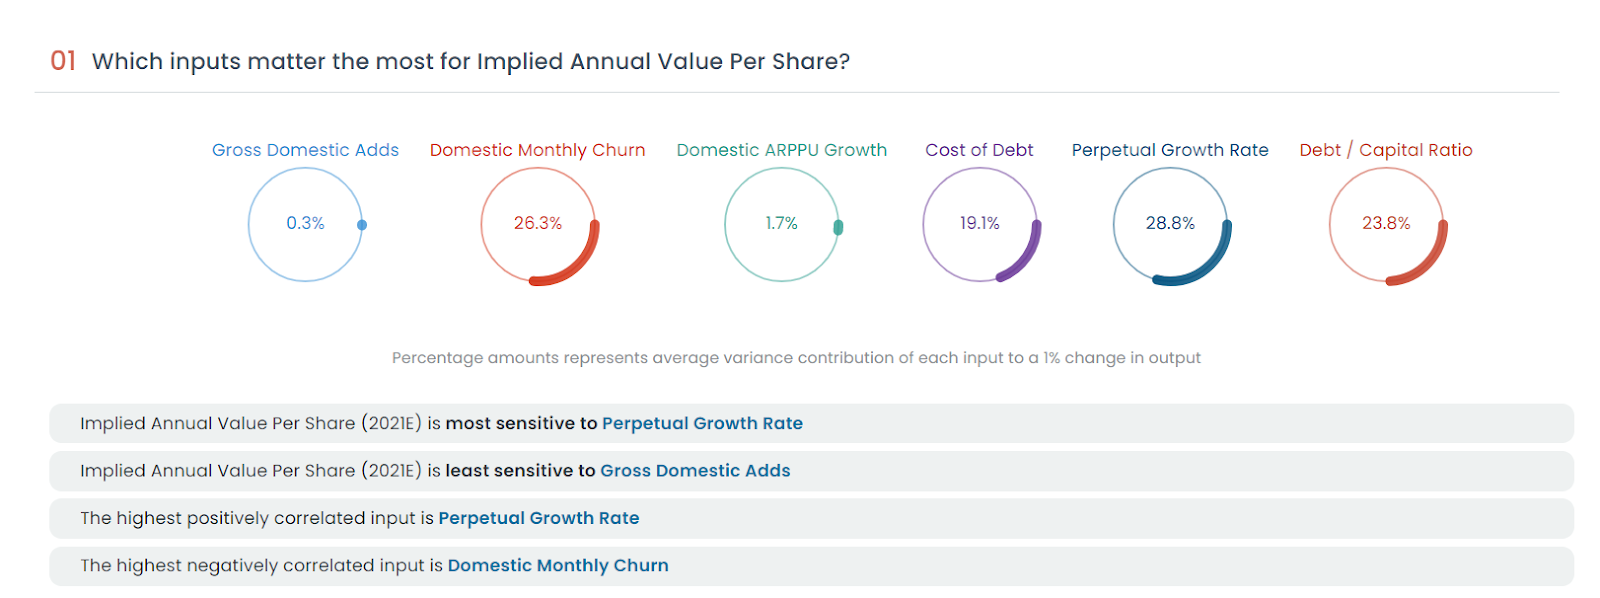
Additionally, a tactyc can run thousands of scenarios in seconds to determine analysis and insights into which model assumptions matter most.
From VisiCalc to Today and Beyond
Just as DocuSign and DocSend changed how legal and business documents are managed, we feel Tactyc will change the way spreadsheets and financial models are used. Tactyc intends to take the spirit of VisiCalc and Lotus 1–2–3 that made the personal PC indispensable and translate into a product for the next decade. There are quite a few customer segments and use cases:
Initial target users will be equity research groups, investment banks, and investors whose use of Excel is in the DNA of their job functions. These power-users spend much of their days in Excel and have colleagues or customers who interact with their spreadsheet work product. The equity research use case is an especially interesting one. Equity research groups sell analysis and knowledge to mostly institutional and retail investors. Their main products are detailed research reports, usually in the form of PDFs that contain static charts and graphs that are driven by underlying (but not accessible) Excel models. An equity research analyst may run bull / base / bear scenarios but if the end user of that analysis wants to run their own unique scenario they are out of luck. Through a Tactyc integration, equity research groups can make their reports dynamic and interactive, further engaging and satisfying their customer base.
Expanding on that power-Excel user, another customer segment are teachers and professors that use Excel to teach business and finance. One such educator, Professor Aswath Damodaran, who holds the Kerschner Family Chair in Finance Education, and is Professor of Finance at New York University Stern School of Business is already a power user and has tweeted numerous times about Tactyc.
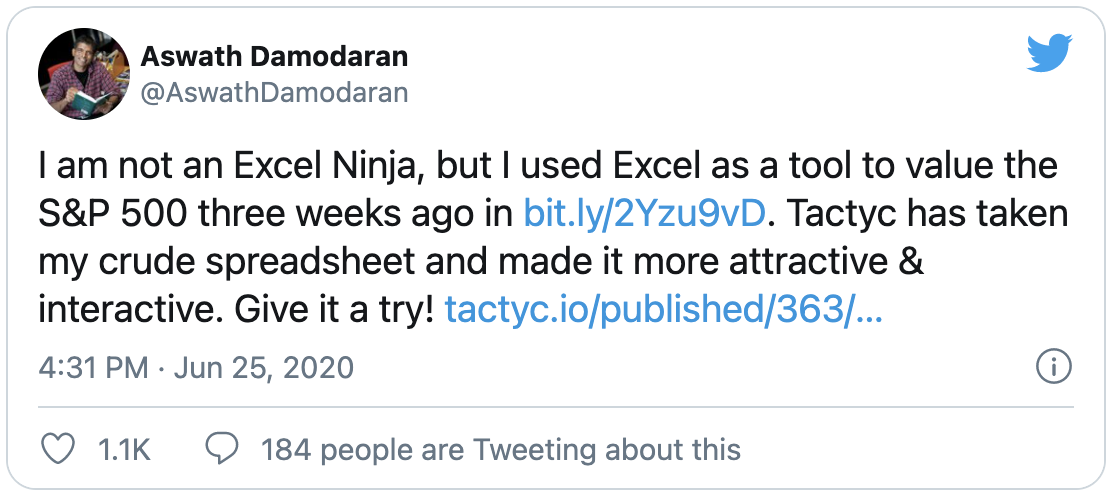
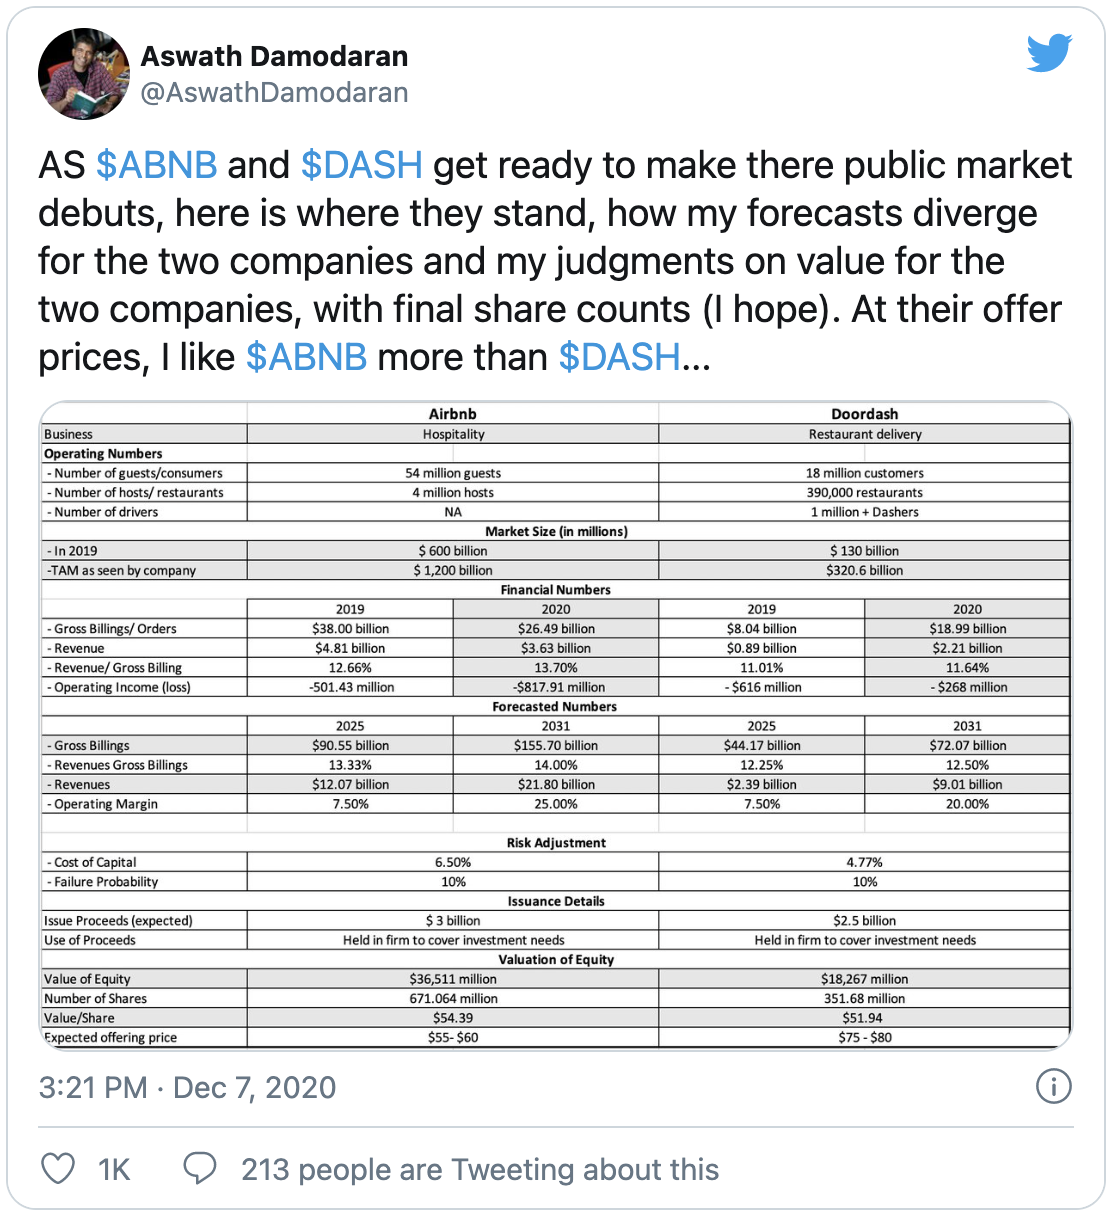
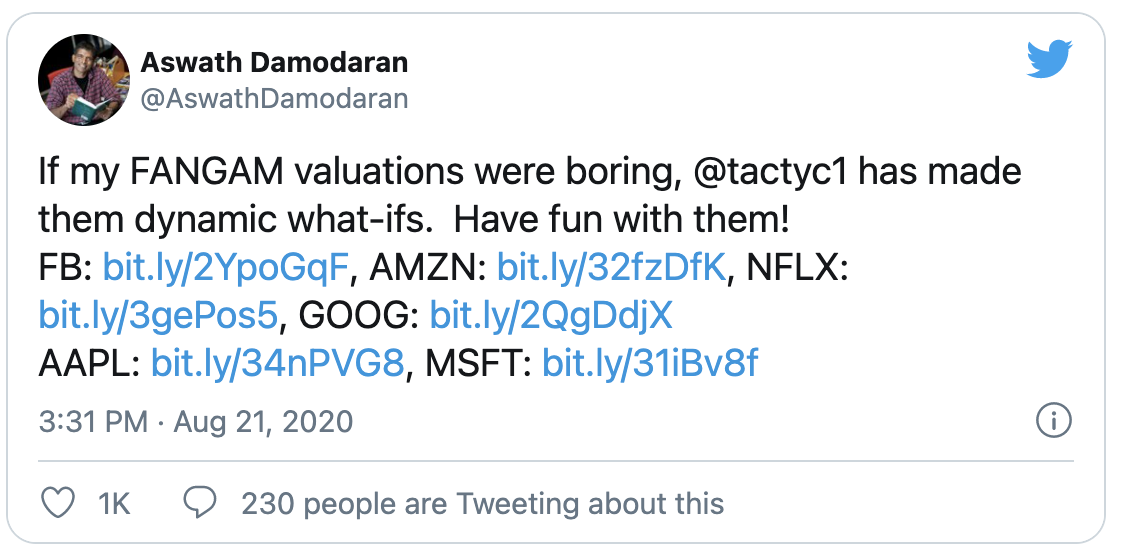
Corporate professionals and those working in various financial planning and analysis, budgeting, marketing and corporate strategy roles will also have their lives made easier through Tactyc. Consultants who publish quarterly or yearly industry deep-dives, like the PWC Global Entertainment & Media Outlook, can make their work product more engaging and insightful.
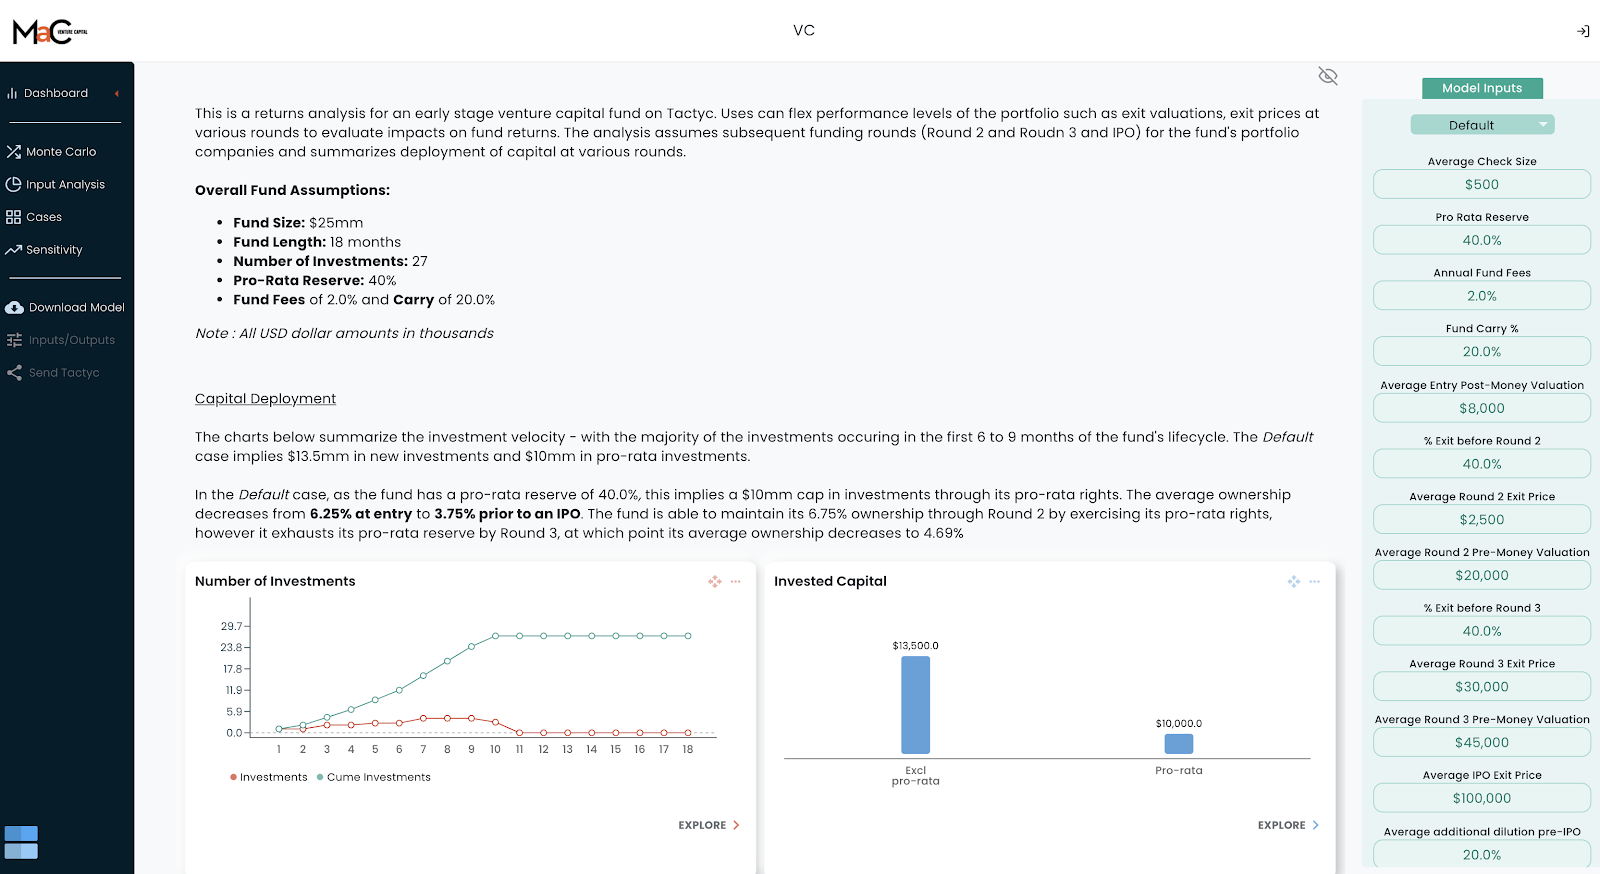
And just as many startups have moved their investor pitch decks onto DocSend for better control and analysis, we anticipate that they will also want to share their financial projections via Tactyc to get insights into the kinds of scenarios run most often by potential investors, or which model inputs were flexed more than others. And most VCs will inevitably build models as part of their diligence process to analyze the underlying “return the fund” assumptions for any particular company. With Tactyc, founders can build this kind of analysis right into their dashboard, giving potential investors the ability to flex underlying assumptions to quickly see the impact on their ultimate fund return. Here is a return-the-fund model we built for Tactyc.
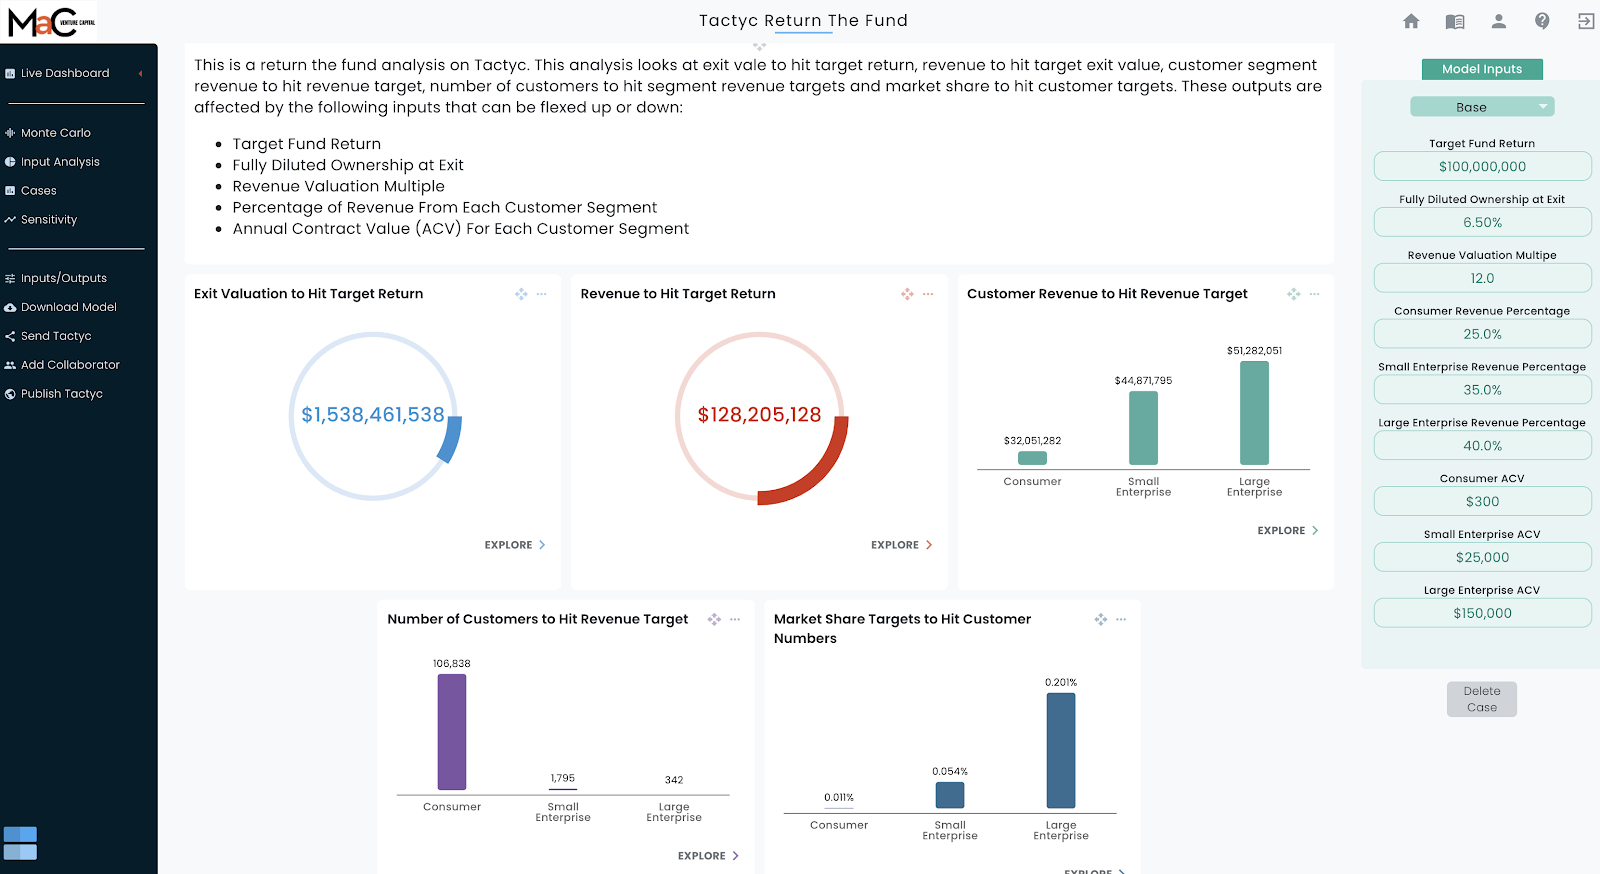
VC funds also build their own portfolio construction models that analyze tradeoffs between various factors that can influence fund performance: total investments, average initial check size, follow-on allocation, ownership targets, etc. This can be done in Tactyc.
The final — and potentially most interesting — use case for Tactyc is within media and publishing. CNN’s “Magic Wall” that live-tracked vote tabulations during the 2020 election, and John King’s rapid-fire analysis of those vote counts is nearly ubiquitous in the public’s consciousness. Imagine the CNBC equivalent during earnings season where Jim Cramer is flexing various financial metrics like new iPhone sales, or Netflix subscriptions and seeing instantly the impact on financial results. Tactyc will enable a new tool in financial reporting on live television.

In a similar fashion, we also see publications like the Wall Street Journal, The New York Times, Fortune and others leveraging the interactive nature of tactycs to make their financial reporting more engaging and sticky.
We are very excited about the future enabled through Tactyc and we will be working closely with them to expand existing use cases and discover new ones. Further unlocking the power of Excel will deliver large benefits to the financial community and beyond.
Michael Palank led the Tactyc Series Pre-Seed round for MaC Venture Capital.
About MaC Venture Capital
Formed in 2019 after the merger of seed funds Cross Culture Ventures and M Ventures, MaC Venture
Capital (MaC VC) backs technology companies that create infectious products that benefit from shifts in
culture trends and behaviors. MaC Venture Capital identifies emerging behavioral trends and
unaddressed multi-billion-dollar challenges, where technology will increase efficiencies, create new
markets, and/ or expedite the move from a growing trend to a cultural/ behavioral norm. MaC VC invests
in talented and uniquely qualified entrepreneurs creating the next generation of technology and consumer
products at the Seed stage.