
The State of Technology & Culture: Energy
Table of Contents
Janta Power- 03 Introduction
- 04 01. The Evolution of the U.S. Energy System
- 13 02. Why Now: Electricity Demand is Accelerating
- 19 03. Energy Transition Constraints
-
26
04. Where Opportunities Exist
- Critical Minerals, Recycling and Domestic Supply Chains
- Firm, Dispatchable and Distributed Power
- Grid Infrastructure, Storage and Energy Orchestration
- Data Center Power, Intelligence and Infrastructure Resilience
- Automation, Robotics and Infrastructure Picks-and-Shovels
- Sustainable Industrial Transportation at Diesel Parity
- 33 05. Conclusion
Introduction
Overview
Energy has always shaped the boundaries of what society can build.
MaC Venture Capital (MaC VC) is a seed-stage firm that invests in emerging sectors and the cultural and technological shifts shaping the future: how behavior changes, how regulation follows, and what technology makes possible.
Periodically, we publish Culture Shifts, a list of the trends we see moving global popular culture. Each one marks an area where we believe the biggest opportunities for growth, innovation, and investment will emerge in the years ahead.
In our latest installment of the State of Technology and Culture Report, we explore the energy sector where we have invested $35.3M in 12 companies. Our interest is driven by the belief that the next generation of economic and technological progress will depend on whether the physical energy system can support it. Energy has always shaped the boundaries of what society can build.
Since humans first mastered fire, every major leap in civilization has followed a new way to harness, convert, or distribute power. Wood and biomass supported early settlement and small-scale industry. Coal powered factories, steel production, railroads, and industrial cities. Oil unlocked mass mobility, aviation, global logistics, and petrochemicals.
Electricity became the foundation of modern homes, healthcare systems, communications networks, manufacturing facilities, and digital infrastructure. In the United States, each expansion of the energy system increased the amount of power available and also the range of economic and technological possibilities available to society.
This report examines the forces reshaping the energy system, the constraints that may slow its development, and the opportunities emerging for founders and investors. The energy transition is often discussed primarily as a shift toward cleaner sources of generation. While decarbonization remains important, the transition is also increasingly being driven by a broader economic imperative to deliver electricity through a system that is more reliable, flexible, affordable, and capable of supporting the next era of industrial and technological growth.
Section 01
The Evolution of the U.S. Energy System
America’s energy system has been repeatedly reshaped by new technologies, sources of supply, and patterns of demand. From combustion and electrification to the rise of oil, gas, nuclear, and renewables, each transition expanded what the economy could support.
Understanding that evolution helps explain the system we have today—and the forces shaping what comes next.
-
01.1 Energy Abundance and Economic Growth
-
01.2 From Combustion to Electrification
-
01.3 How the U.S. Energy Mix Has Shifted
01.1 The Evolution of the U.S. Energy System
Energy Abundance and Economic Growth
The relationship between energy availability and economic development remains visible across the modern global economy.
Reliable and affordable electricity is one of the core inputs that makes prosperity possible. U.S. electricity consumption has grown roughly 14x since 1950,1 and commercial and industrial users accounted for more than 62% of U.S. retail electricity sales in 20251, underscoring electricity’s role as a foundational input for economic activity.
This pattern is also evident in the connection between electricity use and economic output. There is effectively no such thing as a low-energy, high-income country.

01.1 The Evolution of the U.S. Energy System
Wealthy economies, including the United States, sit in the upper-right portion of the chart to the right, combining high levels of per-capita electricity consumption with high levels of income. The poorest economies remain concentrated in the lower-left, where both electricity consumption and income are limited.
Similarly, high-income countries generate approximately 44x more electricity per person than low-income countries, while their GDP per capita is roughly 26x higher.2
This data highlights a strong relationship between electricity consumption, generation, and economic development, reinforcing that access to abundant, dependable power is an important component of sustained economic growth.
Electricity consumption vs Income per capita, 20223

Notes: R^2 =0.83; both axes logged; data is for 2022, circles scaled to population; colors indicate WB income groups
01.2 The Evolution of the U.S. Energy System
From Combustion to Electrification
While energy has always powered economic progress, the way that energy is generated and consumed has evolved considerably.
For much of human history, useful energy came directly from combustion. People burned wood, coal, oil, and gas to create heat, motion, and mechanical power.
By the late nineteenth century, however, primary energy sources such as coal, petroleum, and natural gas increasingly began to be converted into electricity.4
Over the following centuries, electricity became a common input across homes, manufacturing, transportation, communications, and eventually computing.
Thomas Edison’s Pearl Street Station was an early proof point for this model.
In 1882, it became the first commercial central power station and began supplying customers in Manhattan, proving that centralized generation and distribution could work commercially.5
But the early system was limited by direct current, which could only travel short distances.
The adoption of alternating current, championed by George Westinghouse and Nikola Tesla, changed the economics of power distribution because electricity could be transmitted over longer distances.6 That breakthrough allowed power plants to serve entire regions rather than individual neighborhoods.

01.2 The Evolution of the U.S. Energy System
By the early twentieth century, electricity had moved from a technical experiment to a commercially operating infrastructure system.
By 1930, roughly seven in ten American homes were wired for electricity, and nearly nine in ten urban and nonfarm rural homes had access.7
The Rural Electrification Administration (REA), established in 1935 and made permanent by the Rural Electrification Act of 1936, helped close that gap for rural homes.7 With these advancements, the U.S. grid had become one of the country’s most important pieces of economic infrastructure.
-
~70%
of American homes were wired for electricity by 19307
-
~10%
of U.S. farms had electricity in 19357
-
1936
The REA had first been established by executive order in 1935; the 1936 Act made the program permanent and authorized long-term federal loans to finance electric infrastructure in underserved rural areas.8
-
~86%
of U.S. farms were electrified by 1950. Up from just 10.9% in 1935, demonstrating the rapid impact of rural electrification infrastructure buildout.9
01.3 The Evolution of the U.S. Energy System
How the U.S. Energy Mix Has Shifted
The U.S. energy system remains heavily anchored in fossil fuels, even as the sources of growth within the energy mix have begun to change.
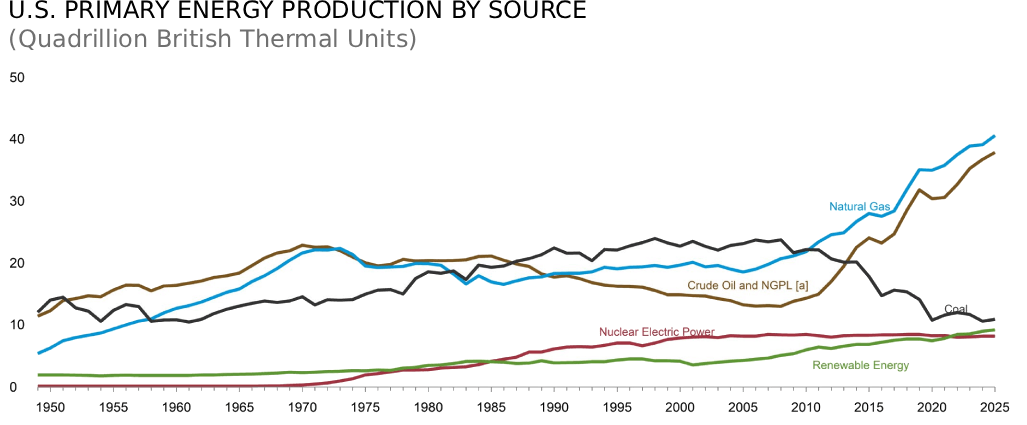
The United States is the world’s largest producer of both crude oil and natural gas, and fossil fuels still accounted for approximately 82% of U.S. primary energy consumption in 2025.10
Natural gas has been the country’s largest source of domestic energy production since 2011, while petroleum remains the most-consumed energy source and is deeply embedded across transportation and the broader economy.
Reports commissioned by the American Petroleum Institute have estimated that the U.S. oil and natural gas industry supports approximately 8% of U.S. GDP, as of their latest report published in 2021.11
-

82%
of U.S. primary energy consumption were fossil fuels in 202510
-
38%
of U.S. primary energy consumption came from petroleum in 2025, making it the country’s most-consumed fuel source10
-
#1
Natural gas has been the largest source of U.S. energy production since 201112


U.S. Primary Energy Production by Source12
(Quadrillion British Thermal Units)
01.3 The Evolution of the U.S. Energy System
The current mix is the product of several major shifts over the past 75 years.
Beginning around 1950, oil separated sharply from coal as the country’s dominant energy source, driven by rising automobile ownership, commercial aviation, freight transportation, suburban development, and petrochemical manufacturing.13
U.S. oil production later peaked in the early 1970s before entering a prolonged decline, and the oil crises of that decade exposed the country’s reliance on foreign producers while strengthening incentives for domestic production, fuel efficiency, nuclear development, and alternative sources of energy.14
The next major inflection came with the expansion of nuclear power during the 1970s and 1980s, as utilities built large reactors to meet rising electricity demand and reduce dependence on fossil fuels.15
That buildout slowed considerably during the 1990s as construction costs increased, project timelines lengthened, electricity markets changed, and regulatory and political barriers became more pronounced.
Nuclear has remained an important source of reliable, low-carbon electricity, but the United States has added relatively little new nuclear capacity over the past several decades.
U.S. Primary Energy Consumption by Source16
(Quadrillion British Thermal Units)

-
1950
Oil Overtakes Coal
Petroleum becomes America’s dominant energy source as automobiles, aviation, freight, and petrochemicals reshape demand
-
1970
U.S. Oil Production Peaks
U.S. crude oil production reached its highest level in history at that point in 1970, as many of the country’s largest conventional oil fields matured.
-
1973-1979
Energy Security Becomes Strategic
Two major oil shocks expose U.S. reliance on foreign supply, accelerating efforts to diversify energy sources and self-sufficiency.
01.3 The Evolution of the U.S. Energy System
Beginning in the mid-2000s, the shale revolution reshaped the mix again.
Advances in horizontal drilling and hydraulic fracturing dramatically increased domestic oil and natural gas production and lowered the cost of gas.
Natural gas plants also became increasingly attractive to utilities because they could be built more quickly, operate more flexibly, and emit less carbon dioxide and conventional air pollution than coal plants. As a result, natural gas displaced a significant share of coal within the U.S. electricity system.
More recently, the growth story has shifted toward renewables. From 2015 to 2025, U.S. renewable energy consumption increased by nearly 29%, while fossil-fuel consumption remained essentially flat, rising approximately 0.15% over the same period.17
Falling equipment costs, improving technology, tax incentives, state procurement requirements, and corporate demand have accelerated the deployment of wind and solar even as fossil fuels continue to dominate the overall system.
01.3 The Evolution of the U.S. Energy System
This shift matters because most renewable energy generation enters the economy as electric power.
As transportation, heating, manufacturing, and computing become more electrified, the grid is becoming the common platform through which a growing share of economic activity is happening.
Electrification allows these systems to draw from a more diverse and lower-emissions mix of generation sources rather than remaining tied to direct fossil-fuel combustion. At the same time, decades of infrastructure investment, established supply chains, and long-lived assets have created an enormous physical base around fossil fuels.
As a result, the energy transition will depend on expanding and upgrading the infrastructure required to move, store, and reliably deliver electricity across a much more electrified economy.
-
Powering Industry

Electrification of Everything
-
Enabling Digital Growth
Data Centers and AI
-
Transforming Mobility
EVs Drive New Demand
-
Building the Future
Smart Buildings and Cities
-
Strengthening the Grid
Resilience, Flexibility and Security
Section 02
Why Now: Electricity Demand Is Accelerating
While these renewable sources are not yet dominant from a generation and consumption standpoint today, their growth reflects a broader transformation of the energy system.
The economy is moving toward electricity at the same time that electricity demand itself is beginning to accelerate. Six forces are pushing more economic activity onto the grid.
-
02.1 AI & Data Centers
-
02.2 Efficiency & Useful Energy
-
02.3 Falling Cost Curves
-
02.4 Transportation
-
02.5 U.S. Industrial Reshoring & Manufacturing
-
02.6 Climate & Policy Pressure
02.1 & 02.2 Why Now: Electricity Demand Is Accelerating
AI & Data Centers
AI is turning electricity into a direct input for digital production.
U.S. data centers consumed roughly 176 TWh of electricity in 2023, or 4.4% of total U.S. electricity use. Berkeley Lab now estimates they could account for up to 12% of U.S. electricity consumption by 2028 as AI workloads scale.18
For the first time, a major new source of U.S. electricity demand is being driven by computation itself. Data centers are now the largest source of projected load growth, accounting for approximately 55% of the increase in electricity demand reflected in utility forecasts over the next five years.19
Efficiency & Useful Energy
Electric technologies can often deliver the same end use with less total energy by converting a greater share of input energy into useful output and reducing losses associated with combustion. This higher end use efficiency means that electrification can allow more economic activity to be powered without requiring an equivalent increase in total energy consumption.
Transportation provides a practical example. A typical EV converts roughly 87%–91% of the energy stored in its battery into vehicle movement, compared with about 30% for a gasoline-powered vehicle, where a significant share of energy is lost as heat.20 As more end uses shift toward electric technologies, these efficiency gains can increase the amount of useful work delivered from each unit of energy consumed.
Useful Energy Delivered
Electric technologies deliver more useful output per unit of energy.
Electric Vehicle vs. Gasoline Vehicle20
87–91%
of battery energy in a typical EV is converted into useful vehicle movement
02.3 Why Now: Electricity Demand Is Accelerating
Falling Cost Curves
Solar, wind, batteries, and power electronics have become dramatically more cost competitive.
In 2024, 91% of newly commissioned utility-scale renewable capacity produced electricity at a lower cost than the cheapest new fossil-fuel alternative, while battery storage costs had fallen 93% since 2010.21
As the cost of generating and storing electricity declines, electrifying end uses becomes increasingly economical on its own merits.
Lazard’s 2026 analysis reinforces the widening cost advantage of renewables, with utility-scale solar and onshore wind competitive with, or below, the cost of new conventional generation.
Lazard Levelized Cost of Energy Report - 2026
Levelized Cost of Energy Comparison—Version 19.022
On a $/MWh basis, unsubsidized renewable energy remains the most cost-competitive form of new-build generation.

02.4 & 02.5 Why Now: Electricity Demand Is Accelerating
Transportation
EV adoption is shifting transportation demand from liquid fuels to electricity.
Electricity consumed by U.S. light-duty EVs increased from roughly 1.6 TWh in 2018 to 23.5 TWh in 2025, nearly a 15x growth increase in seven years. As more cars, trucks, and commercial fleets electrify, energy demand that historically flowed through refineries and gas stations is increasingly being redirected toward the grid and charging infrastructure.23
U.S. Industrial Reshoring & Manufacturing
New factories and advanced manufacturing facilities are creating large, concentrated sources of electricity demand.
U.S. manufacturing construction spending rose by more than 50% in 2022, another 62% in 2023, and 16% in 2024, driven in part by semiconductor fabs, battery plants, and other advanced manufacturing projects.24 These facilities require significant amounts of reliable, affordable power, making regional electricity availability an increasingly important factor in where companies locate and expand.
Manufacturing Construction Spending Is Surging
Year-over-year increase in U.S. manufacturing construction spending
02.6 Why Now: Electricity Demand Is Accelerating
Climate & Policy Pressure
Policy continues to reinforce the shift toward cleaner and increasingly electric energy systems, particularly at the state level.
As of December 2025, 28 states and Washington, D.C. had renewable portfolio standards, while 23 states and D.C. had a requirement or goal to reach 100% renewable or clean electricity by 2050 or earlier.25 These mandates and incentives are helping push utilities, companies, and consumers toward electric and lower-carbon alternatives.

02.6 Why Now: Electricity Demand Is Accelerating

Electrification is pulling more of the economy onto the grid, but scaling that shift is not automatic.
The next phase of the transition depends on whether the physical system underneath it can keep pace, and there are real challenges that determine how quickly that happens.
Section 03
Energy Transition Constraints
With this transition underway, there are implications and challenges with who captures the upside, how fast it moves, and what stands in the way.
The history of energy systems matters because it shows a consistent pattern: when energy becomes cheaper, more reliable, or easier to distribute, it expands what a country can build. Every major energy transition has ultimately been shaped by whether infrastructure could keep pace with demand. Demand is rising at a moment when the system was built for a very different era. And unlike past transitions, where solving one major bottleneck helped unlock the next phase of growth, today’s constraints are more interconnected.
The transition faces the following five structural bottlenecks, each operating at a different layer of the energy stack:
-
03.1 Resource Nationalism & the Geopolitics of Mining and Refining
-
03.2 Grid Congestion & the Interconnection Backlog
-
03.3 Permitting, NIMBYism & the Politics of the Buildout
-
03.4 Storage Duration & the Complexity of Renewable Dispatch
-
03.5 Labor Shortage
03.1 Energy Transition Constraints
Resource Nationalism & the Geopolitics of Mining and Refining
The physical materials that will enable this shift rely on minerals. Batteries depend on lithium, graphite, nickel, cobalt, and manganese. Wind turbines and EV motors rely on rare earth elements. The grid itself requires large volumes of copper and aluminum.26 As electricity demand rises, the constraint is whether the U.S. can secure, refine, and control the physical inputs required to build the system.
The core problem is that mineral supply chains are highly concentrated, especially after extraction. Mining is the process of pulling raw materials out of the ground; refining is what turns those materials into usable industrial inputs, such as battery-grade lithium, processed graphite, separated rare earths, and magnet materials. The U.S. may have access to some reserves and domestic production, but China’s more durable advantage sits in the midstream: separating, refining, and manufacturing critical minerals into usable components.
The Department of Energy’s (DOE) 2023 Critical Materials Assessment makes this exposure clear. The report ranks materials by their importance to energy technologies and their supply risk through 2035, with certain rare earth elements that are essential to the permanent magnets that power electric vehicle motors, wind turbines, advanced electronics, and defense systems being among the highest-risk inputs to the U.S. In 2024, global rare earth reserves totaled more than 90 million tonnes, with China holding roughly 44–45 million tonnes and the U.S. holding about 1.9 million tonnes. While the U.S. produced roughly 45,000 tonnes last year,27 USGS data shows the U.S. remains 100% net import reliant for several nonfuel mineral commodities, with China still the leading supplier across many of them.28
Without more domestic and allied capacity in mining, refining, recycling, and processing, the next phase of U.S. energy infrastructure will remain exposed to tariffs, export controls, geopolitical leverage, and supply disruptions.
2023 DOE Critical Materials Assessment:
Medium Term 2025-2035 29

03.2 Energy Transition Constraints
Grid Congestion &
the
Interconnection Backlog
Much of the U.S. transmission network was built for a different electricity system: large centralized power plants, steadier demand growth, and more predictable flows of power. That architecture is now under strain as the grid absorbs more industrial demand. The problem is that the U.S. needs more electricity and its system cannot move power from where it is generated to where it is needed fast enough.
At a basic level, power is produced by generators, moved across high-voltage transmission lines, delivered through local utilities and distribution networks, and ultimately consumed by homes and businesses. In organized markets, Regional Transmission Organizations (RTOs) and Independent System Operators (ISOs) sit in the middle of that system, coordinating transmission and wholesale power markets so supply can meet demand in real time.
Grid congestion is the power system’s version of a traffic jam. When transmission lines are constrained, low-cost power can get trapped in one region, customers on the other side may have to rely on more expensive local generation, and operators have less flexibility during periods of stress. In the Southwest Power Pool, for example, wind can regularly meet more than 75% of electricity demand across the 14-state region, but limited transmission can leave that power bottled up by congestion.30 This is happening on top of aging infrastructure: 70% of U.S. transmission lines are more than 25 years old, large power transformers average more than 40 years old, and outages have more than doubled versus the prior six-year period.30
How Power Reaches End Customers:

Electricity physically flows from generation to customers; market and coordination layers help route and manage that system.
03.2 Energy Transition Constraints
Grid Congestion &
the Interconnection
Backlog (cont.)
The map on the right shows why this is hard to solve centrally. The U.S. grid is not managed by one unified operator. The Federal Energy Regulatory Commission (FERC) oversees interstate transmission and wholesale power markets, but regional grid operators, utilities, state regulators, and local authorities all shape how power moves and how new infrastructure gets approved.
This regional structure matters because new transmission often has to move through overlapping federal, state, utility, and regional approval processes. Interconnection is where that bottleneck becomes most visible. Before a new power project can connect to the grid, it must go through technical studies that determine whether the system can absorb the project safely, what upgrades are needed, who pays for them, and whether the project creates reliability or cost issues elsewhere. Those studies can take years and cost millions of dollars. Berkeley Lab estimates that nearly 2,600 GW of energy and storage capacity is waiting in U.S. interconnection queues, almost twice the size of the current U.S. grid.31
The scale of required upgrades is enormous. Marsh McLennan, the world’s leading insurance broker and risk advisory firm, estimates that more than 140,000 miles of U.S. transmission lines may need to be replaced by 2050, with fixes and upgrades costing more than $1 trillion.32 The federal government is beginning to respond. DOE’s roughly $1.9 billion SPARK program, announced March 2026, focuses on reconductoring, advanced transmission technologies, and cross-regional coordination,33 while FERC issued show-cause orders, as of July 2026, to the six RTOs and ISOs aimed at accelerating how large loads like data centers connect to the grid.34 The orders push for clearer transmission service rules, co-location and behind-the-meter protocols, faster studies for generation located near load, grid-enhancing technologies like dynamic line ratings, stronger cost recovery from large loads, financial security to discourage speculative projects, and improved load forecasting. The move is meaningful, but it reinforces that there is a coordination problem across areas such as permitting, cost allocation, utility planning, regional market rules, and infrastructure.
Major U.S. RTOs & ISOs35

03.3 Energy Transition Constraints
Permitting, NIMBYism
& the Politics of
the Buildout
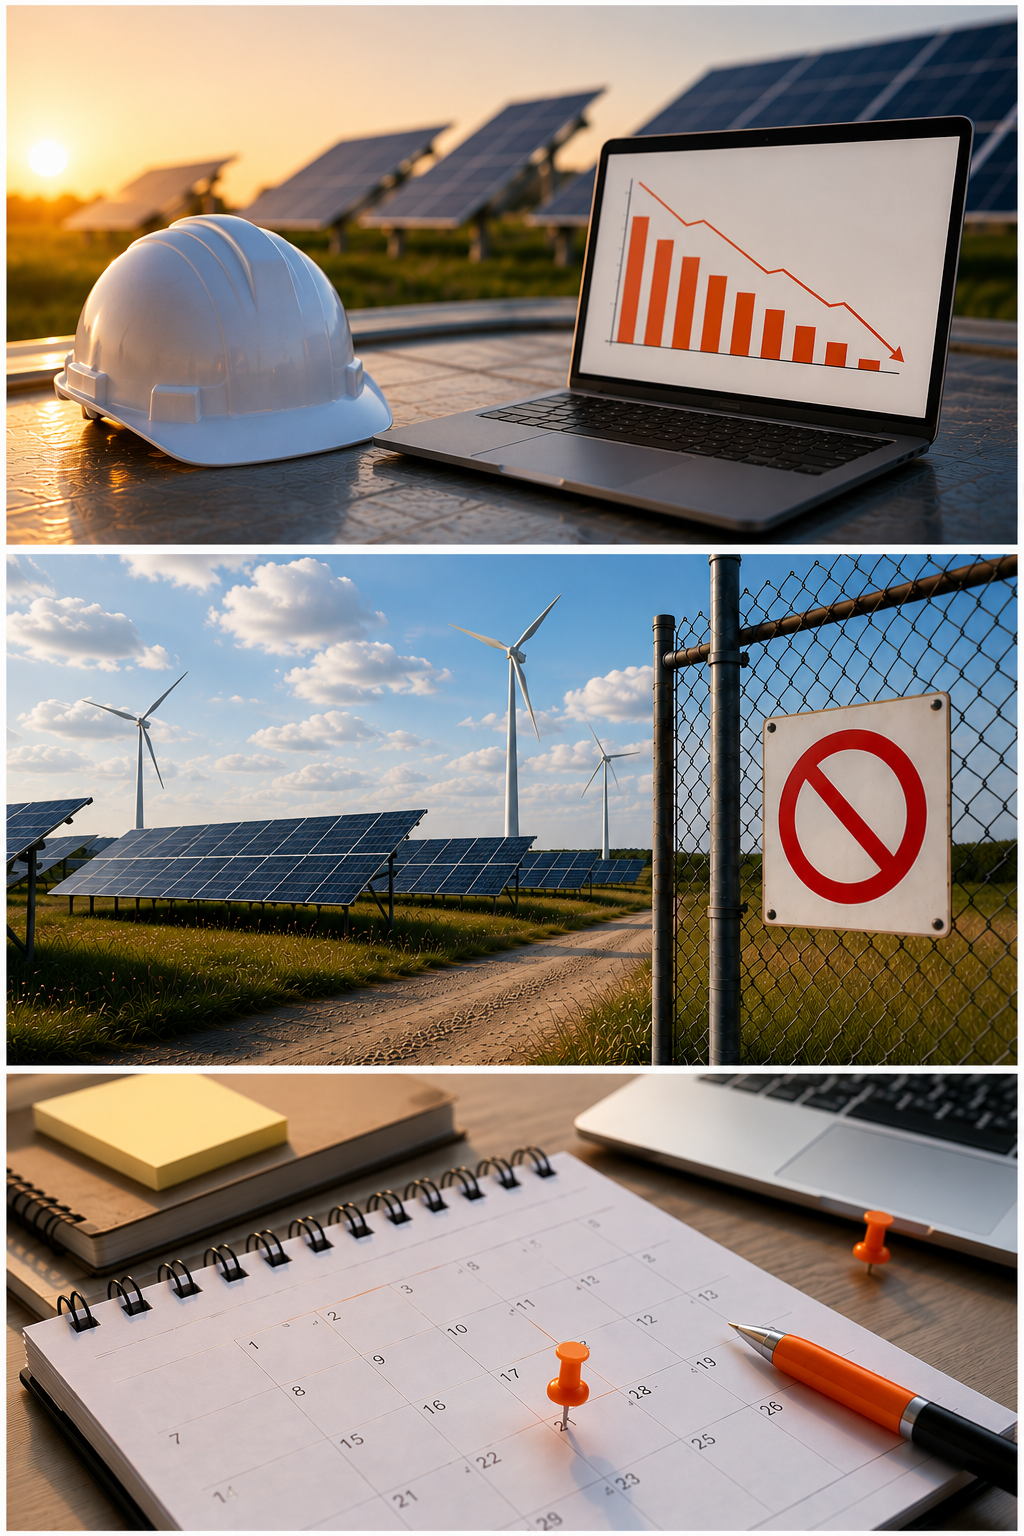
Permitting, land use, and local opposition are another major constraint on the energy transition. New generation, transmission, storage, and industrial facilities all need approvals across federal, state, and local jurisdictions. These projects also navigate community concerns around land, noise, property values, agricultural use, and environmental impact.
A Berkeley Lab survey of large-scale wind and solar developers found that roughly one-third of siting applications submitted in the last five years were canceled, while about half experienced delays of six months or more.36 Local ordinances and zoning, grid interconnection, and community opposition were among the top causes of both cancellations and delays.
So even when projects are economically viable, they can still be slowed or stopped by permitting timelines, community resistance, and fragmented approval processes. As opposition becomes more prevalent and more expensive to address, the speed of the energy transition will increasingly depend on how well projects navigate the communities and jurisdictions where they are built.
03.4 Energy Transition Constraints
Storage Duration & the Complexity of Renewable Dispatch
As the energy transition leans more heavily on renewable power, the grid has to manage an intermittency problem. The fastest-growing renewable sources are wind and solar,38 and both are weather-dependent. In 2025, global renewable power capacity increased by 692 GW, with solar accounting for roughly three-quarters of that growth and wind adding another 159 GW.39 Together, solar and wind represented 96.8% of all net renewable capacity additions that year.39 That deployment mix matters because a grid with more wind and solar faces a different reliability challenge than a fossil-fuel system: generation is variable, but demand is not. Solar output falls every evening, wind can drop for hours or days, and extreme weather can push demand higher at the same time supply becomes less predictable. Storage helps close that gap, but today there are still constraints around both duration and dispatch.
Most utility-scale lithium-ion batteries are built for short-duration use, typically storing enough energy for about one to four hours,40 but less effective for extended periods of low wind and solar output. As storage scales, the challenge is not just having more batteries on the grid, but also operating them well enough across shifting market conditions, reliability needs, and longer-duration gaps to turn variable generation into dependable capacity.
Wood Mackenzie, a global research and consultancy firm specializing in energy, estimates that maintaining reliability under high renewable penetration would require average storage duration to rise from roughly 2.5 hours today to around 20 hours.41 Long-duration energy storage is growing, with global deployments rising 49% in 2025, but it still represented only about 6% of global storage installations that year.41 In other words, storage is scaling, but there is still a gap in scaling the duration profile needed for a deeply renewable grid.
The second bottleneck is operational. Batteries are not simple generators that turn on and off. A storage asset can earn revenue across multiple services, including energy arbitrage, frequency regulation, capacity, and other grid services. Its value depends on when it charges, when it discharges, which market it participates in, and how those decisions affect prices in real time. At low penetration, batteries are mostly price-takers. At scale, they can become price-makers, meaning their own behavior can change the market conditions they are trying to optimize against. As storage scales, more of the value will need to come from the operational layer around activities like forecasting, dispatch optimization, portfolio coordination, market simulation, and understanding how a battery’s own actions affect clearing prices.
03.5 Energy Transition Constraints
Labor Shortage
The energy transition also depends on people. Building and upgrading the grid requires roles such as electricians, engineers, line workers, technicians, plant operators, and other skilled workers.42 These roles are needed across the full deployment cycle: building generation projects, installing equipment, inspecting assets, maintaining infrastructure, manufacturing components, and expanding transmission and distribution systems.
Demand for this labor is rising quickly, but the workforce is already constrained.
60%
of energy companies worldwide report labor shortages, according to the IEA, particularly in technical roles such as electricians, line workers, engineers, and plant operators.42
2.4
energy workers are nearing retirement for every new entrant under 25, highlighting the growing pressure of an ageing workforce, particularly in advanced economies.42
40%+
growth in qualified new entrants to the global energy sector is needed to prevent labor shortages from worsening by 2030.42
Section 04
Where Opportunities Exist
While the constraints discussed in the prior section represent barriers to the transition, they are also signals for where new companies can create value. We believe some of the most compelling opportunities will come from companies that either expand the supply of energy itself or remove the physical, financial, and operational constraints preventing that supply from reaching customers.
-
04.1 Critical Minerals, Recycling &
Domestic Supply Chains -
04.2 Firm, Dispatchable, & Distributed Power
-
04.3 Grid Infrastructure, Storage
& Energy Orchestration -
04.4 Data Center Power, Intelligence &
Infrastructure Resilience -
04.5 Automation, Robotics & Infrastructure
Picks-and-Shovels -
04.6 Sustainable Industrial Transportation
at Diesel Parity
04.1 Where Opportunities Exist
ConiferCritical Minerals, Recycling
& Domestic
Supply Chains
Opportunity extends well beyond simply mining more material. The U.S. also needs greater capacity to refine, process, recover, and reuse critical minerals already circulating through batteries, motors, electronics, industrial equipment, and other products. Recycling can effectively turn existing products and waste streams into a secondary domestic resource base, reducing the amount of new material that needs to be mined while keeping strategically important inputs in circulation.
This creates opportunities across battery recycling, rare-earth magnet recovery, mineral refining, waste-stream recovery, and closed-loop manufacturing. Notable startups in the space include Redwood Materials and Cyclic Materials. Redwood Materials, one of the more heavily funded companies in the category, closed a $425 million Series E in January 2026, bringing its total equity capital raised to more than $2 billion. The company now processes more than 20 GWh of lithium-ion batteries annually and recovers more than 95% of critical materials including lithium, nickel, cobalt, and copper for reuse in the domestic supply chain. Cyclic Materials, which focuses on recovering rare earth elements from end-of-life magnets, electronics, and manufacturing waste, raised a $75 million Series C in January 2026, bringing its total funding to approximately $156 million. Its planned U.S. facilities are designed to turn end-of-life products into recycled rare-earth oxides that can flow back into magnet manufacturing.
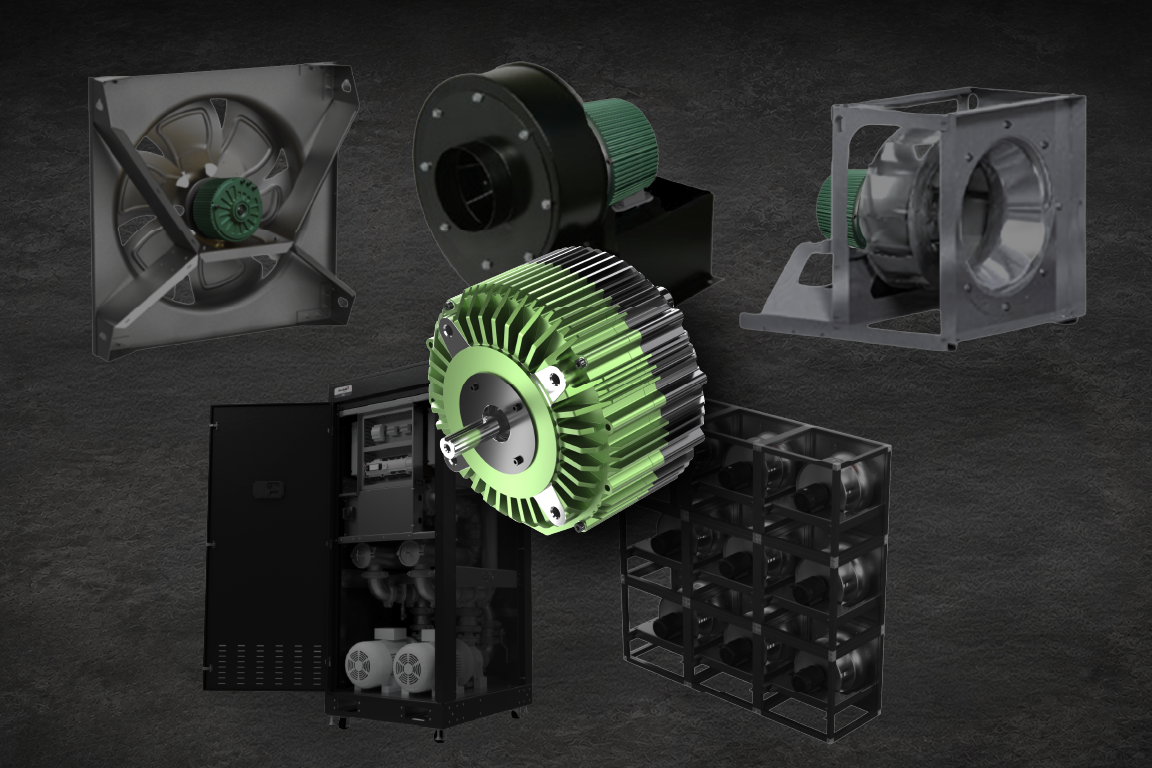
There is also an opportunity to reduce dependence on constrained inputs altogether. Conifer* is approaching this problem by building rare-earth-free electric powertrains, while Hexium* is developing laser-based isotope separation technology intended to strengthen domestic access to specialized inputs for advanced nuclear and other frontier energy systems. The broader opportunity can be two-sided: recover and produce more of the materials the system requires, while engineering new technologies that require fewer vulnerable inputs in the first place.
04.2 Where Opportunities Exist
Firm, Dispatchable, & Distributed Power
The optimal solution is not one power generation source, but rather a combination of all of them. Solar and wind are an increasingly larger part of the mix, but they have their tradeoffs: intermittency, land constraints, transmission congestion, and long interconnection timelines. This increases the value of power that can be firm, dispatchable, or located directly alongside demand. Nuclear, geothermal, long-duration storage, and land-efficient generation each address different parts of that gap. This creates an opportunity not only to develop new forms of generation, but also to rethink where power can be located, how quickly it can be deployed, and which historically constrained energy resources can become more scalable.
Nuclear is one area where companies are experimenting with new reactor sizes, deployment models, and customer configurations. BlueCore Energy* is developing floating nuclear power systems designed to bring firm, carbon-free electricity directly to ports and other large coastal energy users. BlueCore’s* approach is differentiated by placing generation close to demand while reducing land and transmission requirements. The company is headquartered inside the Port of Long Beach, where it has secured space to assemble, test, and store its maritime power modules. BlueCore* has garnered support from the Port of Long Beach, Mayor of Long Beach, and local leadership; in July 2026, this Port became the first U.S. seaport to partner formally with the U.S. Maritime Administration to advance small modular reactor technology for maritime uses. Previously venture backed companies, such as NuScale and Oklo, are now trading on the public market and pursuing different opportunities through nuclear. NuScale has focused on modularizing conventional light-water reactor technology; in May 2025, the NRC approved its reactor design, allowing the design to be referenced in future construction and operating-license applications. Oklo is taking a different approach with smaller advanced reactors designed to serve large customers more directly. The company has entered into an agreement with Meta that provides a mechanism for Meta to fund development and prepay for power from a planned Ohio nuclear campus
that could scale to 1.2 GW. Together, these companies illustrate how nuclear is being reimagined across maritime, modular utility-scale, and customer-sited applications.
Geothermal is undergoing a similar expansion in what is technically and geographically possible. Critical Energy* is developing modular geothermal systems intended to make firm generation faster and easier to deploy. Fervo Energy is applying horizontal drilling and other techniques developed by the oil and gas industry to enhanced geothermal systems, allowing geothermal development in areas that do not have naturally occurring conventional reservoirs. Its Cape Station project in Utah is expected to begin delivering 100 MW by the end of 2026 and expand to 500 MW by 2028.43 Capital formation around the company has accelerated alongside that development: Fervo raised a $462 million Series E in December 2025, then completed an IPO in May 2026. The model demonstrates how existing drilling technologies can unlock a historically geographically constrained source of 24/7 power.
Solar is also evolving beyond the traditional model of large, ground-mounted projects. Janta Power* is using vertical solar towers to increase energy production per acre in land-constrained environments such as airports, data centers, and industrial facilities. Other emerging approaches that are interesting include pairing solar more tightly with storage or designing systems for behind-the-meter deployment, making solar more useful in locations where land availability, interconnection capacity, or time-to-power are the primary constraints.
Other areas that could be attractive for investment include long-duration storage, waste-heat recovery, microgrids, and technologies that make existing generation more modular, transportable, or easier to site. The common thread is not any one fuel or generation source, but technologies that can deliver reliable power faster, closer to demand, and with fewer infrastructure constraints.
04.3 Where Opportunities Exist
PowerlineGrid Infrastructure, Storage
& Energy
Orchestration
More generation does not solve the problem if the grid cannot connect, move, store, or manage it. In many cases, the opportunity is not only to build new infrastructure, but to extract more capacity and visibility from the infrastructure already in place.
On the physical grid, this includes grid-enhancing technologies, power electronics, sensing, and monitoring systems. Gridware is attacking the visibility problem through pole-mounted sensors that continuously monitor mechanical, electrical, and environmental conditions across distribution infrastructure. After raising a $26.4 million Series A led by Sequoia in February 2025, the company raised another $55 million Series B in November 2025 led by Tiger Global and Generation Investment Management to scale deployments. Alongside physical grid constraints, software and workflow inefficiencies are key contributors to the interconnection backlog. Abundance Energy is building an agentic operator system for power grids, starting with interconnection queue management. Abundance’s product, an agentic grid engineer, deploys AI agents trained on grid rules to review interconnection application documents, flagging passes and failures for engineers to accept or reject with reasoning. The long-term vision is to own all manual operational workflows within grids, starting with interconnection.
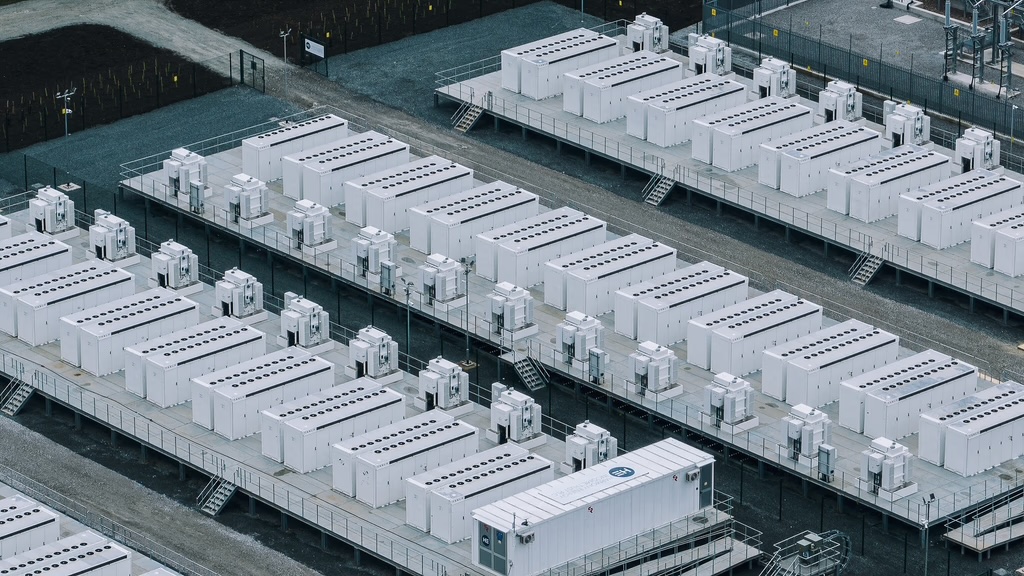
Storage represents another major infrastructure opportunity because an increasingly renewable grid needs to shift electricity across both hours and days. Safire* addresses one portion of this stack through technology intended to improve lithium-ion battery safety. At the other end of the duration spectrum, the software opportunity grows alongside storage because batteries and other flexible energy assets do not create maximum value simply by being connected to the grid; their economics depend on when they charge, discharge, bid, and respond to changing market conditions. Powerline* is building an AI-native intelligence layer for grid-scale battery portfolios, using digital testbeds and market modeling to help developers and asset owners evaluate projects, forecast market behavior, benchmark performance, and optimize operations.
The common thread is enabling the grid to do more with both new and existing infrastructure. As electricity becomes a larger part of the economy, value should accrue also to those that determine whether that power can be connected, stored, moved, observed, operated, and monetized efficiently.
04.4 Where Opportunities Exist


Data Center Power, Intelligence & Infrastructure Resilience
AI data centers are creating another emerging opportunity layer. Higher-density compute increasingly requires coordinating power availability, cooling, facility controls, grid interaction, equipment health, cybersecurity, and workload behavior across infrastructure where downtime can have enormous economic consequences.
This creates room for software and intelligence companies built specifically for mission-critical physical infrastructure. Phaidra, for example, is developing AI agents that continuously monitor and optimize data-center systems, including power availability and thermal performance. The company recently raised a $50 million Series B round in October 2025, led by Collaborative Fund and NVIDIA, bringing its total lifetime funding to approximately $120 million. Kumio is approaching the problem from the security side. The company looks to be a continuous cyber-physical security layer for AI data centers, using autonomous agents to identify vulnerabilities across the operational technology and control systems that keep facilities running.
Rune Energy is taking a different approach by bringing compute directly to energy rather than waiting for grid infrastructure to bring energy to compute. The company is developing modular, behind-the-meter micro data centers that can be deployed directly alongside solar and wind assets. By bypassing the traditional grid, Rune can capture renewable generation that might otherwise be curtailed, clipped, or stranded and convert it into compute capacity for AI training and other power-intensive workloads. The model illustrates how increasingly flexible compute workloads could become a new source of demand for generation that is available but difficult to deliver through constrained transmission infrastructure.
As AI infrastructure scales toward hundreds of megawatts and eventually gigawatt-scale campuses, both the intelligence layer and the underlying hardware needed to support that growth will become increasingly critical by helping operators identify available capacity, use power more flexibly, optimize cooling and equipment performance, and secure an increasingly complex physical system.
04.5 Where Opportunities Exist
Cosmic RoboticsAutomation, Robotics &
Infrastructure
Picks-and-Shovels
Because the energy transition will require a massive physical buildout, labor availability and execution speed could become meaningful constraints. This makes the distinction between traditional services businesses and technology-enabled services companies particularly important. Traditional contractors typically scale by adding more people, keeping revenue and output closely tied to headcount. Robotics, autonomy, software, and remote operations can change that equation by allowing each worker to install, inspect, or maintain more infrastructure, increasing productivity without requiring labor to scale at the same rate.
is applying robotics to solar installation, automating portions of a labor-intensive construction process in order to increase deployment speed and reduce the amount of manual work required per project.
applies a similar model to utility infrastructure inspections, using AI to analyze visual data captured by drones, helicopters, and field crews to detect faults and anomalies, helping utilities inspect and maintain more assets with less manual review.
These examples highlight how technology can materially increase throughput per worker and can potentially service more projects, geographies, and infrastructure with a much smaller increase in labor and operating resources.

04.6 Where Opportunities Exist
Sustainable Industrial
Transportation at
Diesel Parity
Commercial transportation remains one of the hardest sectors to decarbonize because diesel is remarkably effective at what heavy-duty fleets need: long range, rapid refueling, high payload capacity, and a mature fueling network. For alternative technologies to reach meaningful adoption, innovative and more sustainable solutions need to be comparable to total cost and day-to-day operability.
Battery-electric trucking is beginning to move from pilot programs into commercial fleets, particularly for drayage, regional distribution, and other routes where mileage is predictable and trucks can return to a depot to charge. Major OEMs are increasingly bringing electric Class 8 trucks to market: Volvo’s VNR Electric can reach up to 275 miles depending on configuration, and Tesla is targeting up to 500 miles for its Semi. As the vehicles themselves become more capable, however, the constraint increasingly shifts toward the infrastructure around them. Fleets need access to high-power charging, sufficient utility capacity, depot upgrades, and energy management.
That creates opportunities for companies building the infrastructure layer around commercial electrification. Unreal Energy, for example, is developing technology for vehicle electrification and zero-emission transportation across batteries, charging infrastructure, and software for operating and managing electric vehicles and charging systems. Companies in this layer could become increasingly important as fleets move from purchasing a handful of electric trucks to managing hundreds of vehicles whose charging schedules and power requirements must be coordinated with depot operations and the grid.
Hydrogen could address a different portion of the market, particularly long-haul applications where carrying very large batteries can reduce payload and where fleets value diesel-like range and refueling times. Fuel-cell trucks can store considerably more energy onboard without requiring proportionately larger batteries. Clean hydrogen has historically remained expensive, while high-throughput fueling infrastructure for heavy trucks is still limited, leaving its economic competitiveness dependent on significant reductions in hydrogen production and distribution costs.
There is also a pathway that does not require replacing the vehicle fleet immediately. WayTrade* is building a technology-first marketplace for the feedstocks used to produce lower-carbon fuels such as renewable diesel and sustainable aviation fuel. Its platform connects fuel producers with a global network of feedstock suppliers while managing counterparty matching, pricing, transportation, payments, tracking, regulatory compliance, and traceability. Rather than reinventing the truck itself, companies like WayTrade* can help make the supply chains behind lower-carbon fuels more reliable and scalable.
05.1 The State of Technology & Culture: Energy
Conclusion
A new energy stack is taking shape. Every previous energy transition expanded what the economy could build: coal delivered factories and railroads, oil delivered mobility and global logistics, electricity delivered the modern home and the digital economy. What is different this time is that demand is arriving faster than the physical system can absorb it. Data centers consumed 4.4% of U.S. electricity in 2023 and could reach 12% by 2028. Nearly 2,600 GW is sitting in interconnection queues, almost twice the size of the entire grid it is waiting to join.
That gap is the opportunity. The constraints in this report are not an argument against the transition. They are a map of where value gets created. Every bottleneck we identified, from refining capacity to interconnection queues to storage duration to the labor needed to build any of it, is a market waiting on someone to solve it. The companies that clear those bottlenecks will not simply participate in the buildout. They will set its pace.
We are early. Most of the technologies, business models, and infrastructure layers that will define the next several decades are still being invented. The companies in this report are working on the first version of the problem, not the last, and physical infrastructure tends to reward the people who show up before the category is obvious.
At MaC VC, we are actively backing founders building across this new energy stack. If you are building here, investing alongside us, or operating the infrastructure that will make it possible, we want to hear from you.


Endnotes
- 1Electricity Explained, U.S. Energy Information Administration
- 2Per Capita Electricity Generation vs. GDP per Capita 2025, Our World in Data
- 3High-Income Low-Energy Countries Don’t Exist [update Sep 2024], Energy for Growth Hub
- 4The 250-year history of U.S. energy consumption, U.S. Energy Information Administration
- 5Model of Edison’s Pearl Street power station, si.edu
- 6How Edison, Tesla and Westinghouse Battled to Electrify America, History.com
- 7Electricity Consumption: Culture, Gender and Power, Energy History, Yale.edu
- 8Electrifying Rural America, Richmond Fed
- 9Annual Budget Message to the Congress: Fiscal Year 1952, Harry S. Truman
- 10U.S. energy facts explained, U.S. Energy Information Administration
- 11Impacts of the Oil and Natural Gas Industry on the US Economy in 2021, American Petroleum Institute
- 12August 2026 Monthly Energy Review, U.S. Energy Information Administration
- 13The 250-year history of U.S. energy consumption, U.S. Energy Information Administration
- 14The Oil Shocks of the 1970s, Energy History, Yale.edu
- 15Nuclear Energy, Our World in Data
- 16August 2026 Monthly Energy Review, U.S. Energy Information Administration
- 17August 2026 Monthly Energy Review, U.S. Energy Information Administration
- 18Berkeley Lab Report Evaluates Increase in Electricity Demand from Data Centers, lbl.gov
- 19Power Demand Forecasts Revised Up for Third Year Running, Led by Data Centers, Grid Strategies LLC
- 20FOTW #1360, Sept. 16, 2024: A Typical EV is 87%–91% Efficient Compared to 30% for a Conventional Gasoline Vehicle, U.S. Department of Energy
- 21Renewable Power Generation Costs in 2024, IRENA
- 22Lazard’s Levelized Cost of Energy+ (LCOE+), Lazard
- 23U.S. Estimated Consumption of Electricity by Light-Duty Electric Vehicles Types, 2018–May 2026, Table D.1, Electric Power Monthly, U.S. Energy Information Administration
- 24Manufacturing Construction Spending Declines Under Trump, FactCheck.org
- 25Renewable energy explained - renewable portfolio and clean energy standards, U.S. Energy Information Administration
- 26Executive Summary: The Role of Critical Minerals in Clean Energy Transitions, IEA.org
- 27Rare Earths, USGS.gov
- 28US Critical Mineral Import Dependence, Third Way
- 29What Are Critical Minerals and Materials?, U.S. Department of Energy
- 30Creaky U.S. power grid threatens progress on renewables, EVs, Reuters Investigates
- 31Grid connection backlog grows by 30% in 2023, dominated by requests for solar, wind, and energy storage, emp.lbl.gov
- 32Creaky U.S. power grid threatens progress on renewables, EVs, Reuters Investigates
- 33Speed to Power through Accelerated Reconductoring and other Key Advanced Transmission Technology Upgrades (SPARK), US Department of Energy
- 34FERC Launches Aggressive Targeted Action to Speed Large Load Integration, ferc.gov
- 35Why Are Electric Rates Higher Within Regional Transmission Organization (RTO) Regions? Dysfunction Maybe?, Energy Security and Freedom
- 36Large-scale wind and solar developers concerned about social factors affecting deployment, emp.lbl.gov
- 37Queued Up: 2026 Edition, emp.lbl.gov
- 38Renewable Energy, Center for Climate and Energy Solutions
- 39Renewable Capacity Highlights, IRENA
- 40The Battery Storage Delusion, National Center for Energy Analytics
- 41Long-duration energy storage deployments rose 49% in 2025: WoodMac, Utility Dive
- 42Energy Snapshot: What’s Driving the Surge in Energy Jobs, International Energy Agency
- 43Could geothermal be nation’s cheapest power?, The University of Utah
The State of Technology & Culture:
Thank You